Performance management for your WebSphere applications
When a friend sent “A Helpdesk Log” to me many years ago I thought it was hilarious, and even though so much has changed in IT since then I think it still holds up pretty well: https://www.cs.cmu.edu/~mbaur/j1.html
Hopefully you got a laugh or two from that, but there’s certainly much better ways to handle issues. Here are a few examples I’ve seen from working with applications running on WebSphere Application Server (WAS):
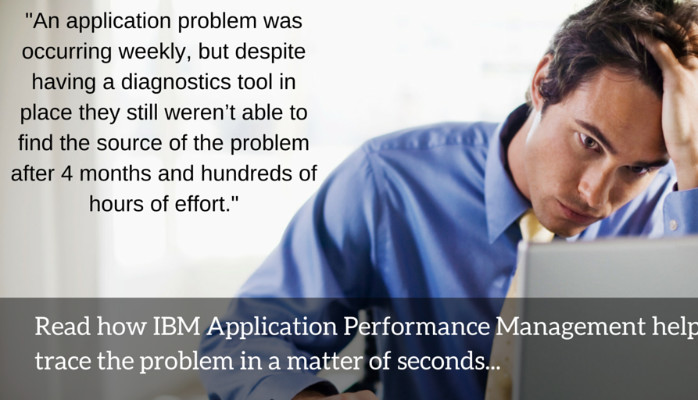
- An application problem was occurring once or twice a week, but despite having a diagnostics tool in place they still weren’t able to find the source of the problem after four months and hundreds of hours of effort. Using IBM’s Application Performance Management (APM) solution, they were able to trace the problem in a matter of seconds to a call from the WAS server to a CICS server, and with deep diagnostics into CICS they were able to determine the root cause of the problem.
- An application was failing with an Out Of Memory condition. By monitoring the WAS Java Virtual Machine (JVM) with IBM APM, they were able to see the increase in heap usage under load, and also that it wasn’t being released during periods of inactivity. Using the memory diagnostics capability they were able to identify uncollected objects and even the suspected line of code causing the leak.
- In another case, the WAS engineer decided to be proactive and rather than wait for a performance issue to be reported used IBM APM to trace transactions, identifying several bottlenecks in the code. This information allowed the development team to optimize the performance of the application, avoiding any user impact.
In order to solve these types of problems quickly with minimal effort, there are several key capabilities that are required.
- You need to capture information on all of the request instances flowing through the WAS server so that you don't miss anything.
- You need to be able to obtain code-level information in production without impacting the server’s performance significantly. This allows you to find the root cause without having to recreate the problem in a pre-production environment, which is time-consuming and sometimes impossible. That was the case in the first scenario I described – the tool they had required too much overhead to be used to obtain method-level traces in production, and they weren’t able to reproduce the issue in a pre-production environment.
- You need to be able to easily monitor the health of the JVM and spot trends occurring over time. Better yet, IBM APM provides integrated predictive analytics which can automatically alert you to those trends and even identify correlated metrics that may be the cause of the problem.
With the help of IBM APM, you can dramatically reduce the amount of time you spend troubleshooting problems without resorting to the types of tactics used in “A Helpdesk Log.”
Confidential
8y973 335 7800
Operations Manager at Symplore Inc
8yCan I have job details to ravikirangantela@gmail.com